RTSP camera monitoring: the 60 Mbit/s that never existed
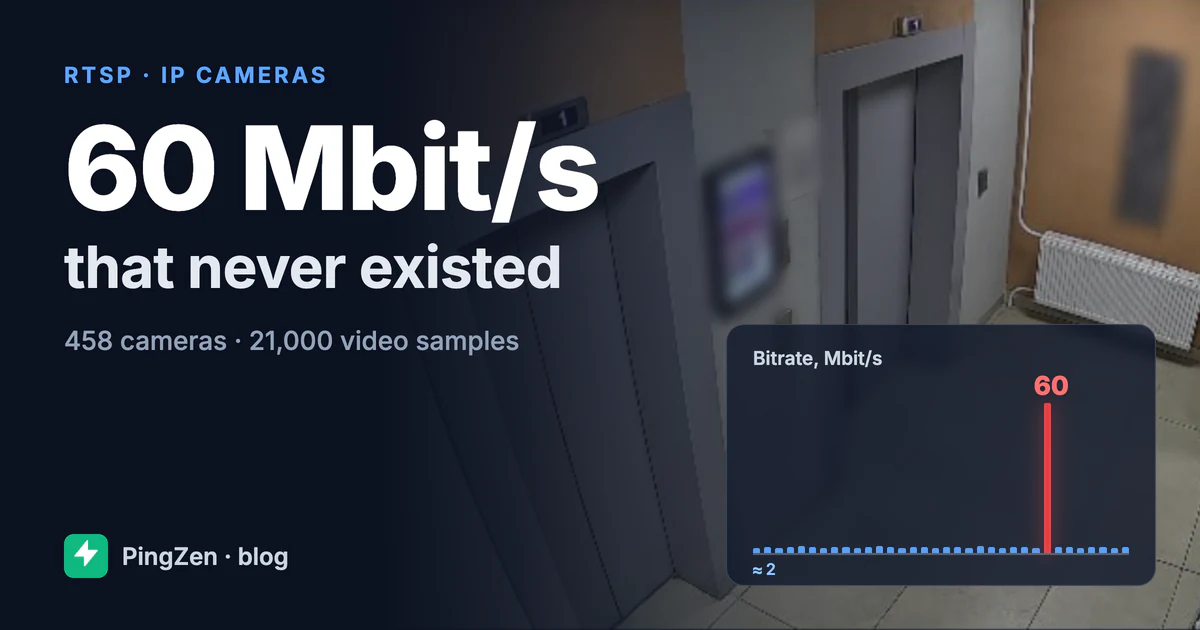
How we monitor IP cameras over RTSP, measure frame rate and bitrate from RTP timing without decoding video, and where a 60 Mbit/s reading came from.
Read article →Guides, tutorials, and product updates on uptime monitoring.
How we monitor IP cameras over RTSP, measure frame rate and bitrate from RTP timing without decoding video, and where a 60 Mbit/s reading came from.
Read article →External monitoring checks your site from the outside — the way your users see it. What it catches that Zabbix and Prometheus cannot, what to check, from how many locations, how to avoid alert fatigue, and how to compare services.
Read article →Save all your monitors to one CSV file, and add many monitors at once from a spreadsheet. Files from StatusCake, UptimeRobot, and HetrixTools work too. You see a preview before you import, get a clear result for every row, and can use two new MCP tools for AI agents.
Read article →Monitors pointed at hosts with a Минцифры (НУЦ) certificate no longer fail on trust. PingZen now recognises the Russian Trusted Root CA for its checks — scoped to the check itself, and gated to Russian domains by default.
Read article →Every check location now shows its IP address. Click it and it is on your clipboard, ready for your firewall or WAF allowlist. The addresses stay current — the server observes them as each checker connects.
Read article →The "Ping arrivals" journal in the heartbeat monitor card was failing with a 500 error — it works now. No data was lost — the full ping history was recorded all along and is available retroactively, including the message field from ping bodies.
Read article →You asked — we shipped: heartbeat check-in intervals up to 30 days right from the dashboard, grace periods up to 24 hours, and honest uptime stats for long-interval monitors.
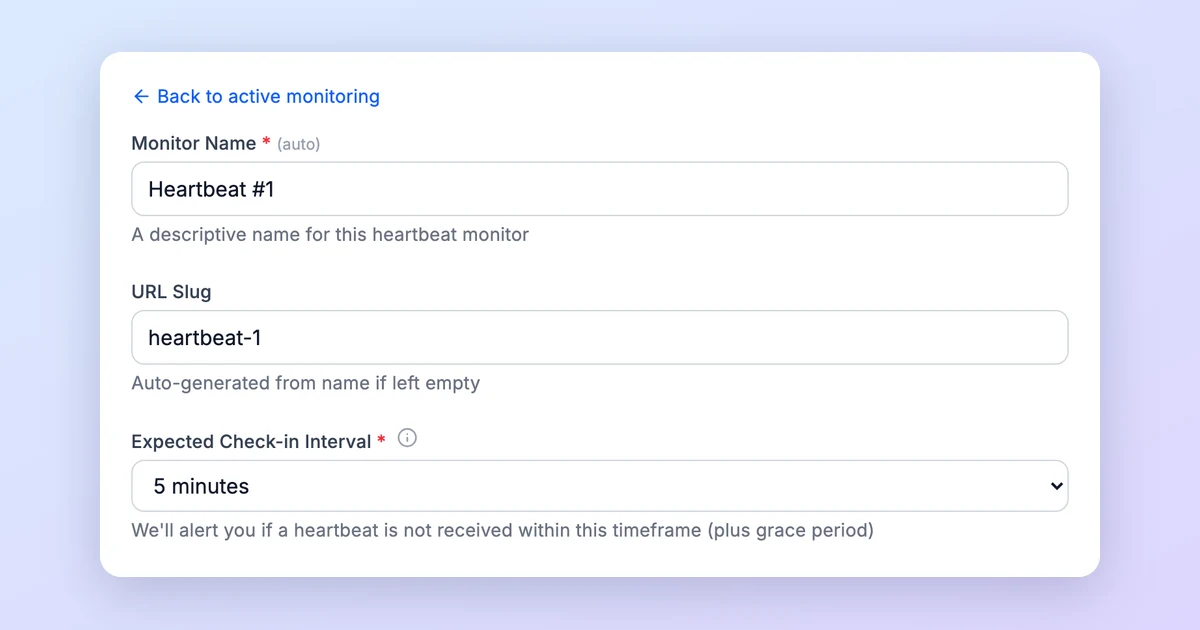
Read article →A DOWN heartbeat now lights up the dashboard and sidebar like any other outage, you can click any heartbeat to see when its pings actually arrived, and a handful of rough edges in the create flow are gone.
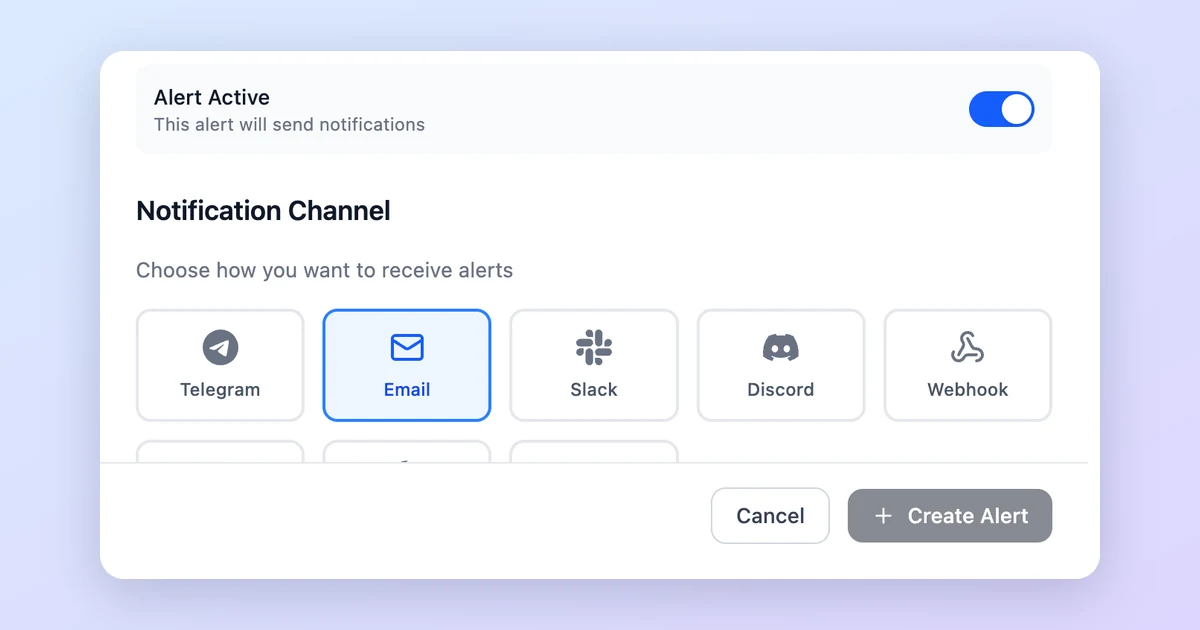
Read article →PingZen's alert form is rebuilt — duplicate an alert to a second channel in one click, a shorter default form with collapsible Advanced settings, and triggers that only show the events a monitor can actually report.
Read article →Every monitor now has a Download report button — on the monitor page and in the monitors list. Pick a period and PDF or CSV, and you get uptime, MTTR/MTBF, latency percentiles, incidents, and error budget in one file.
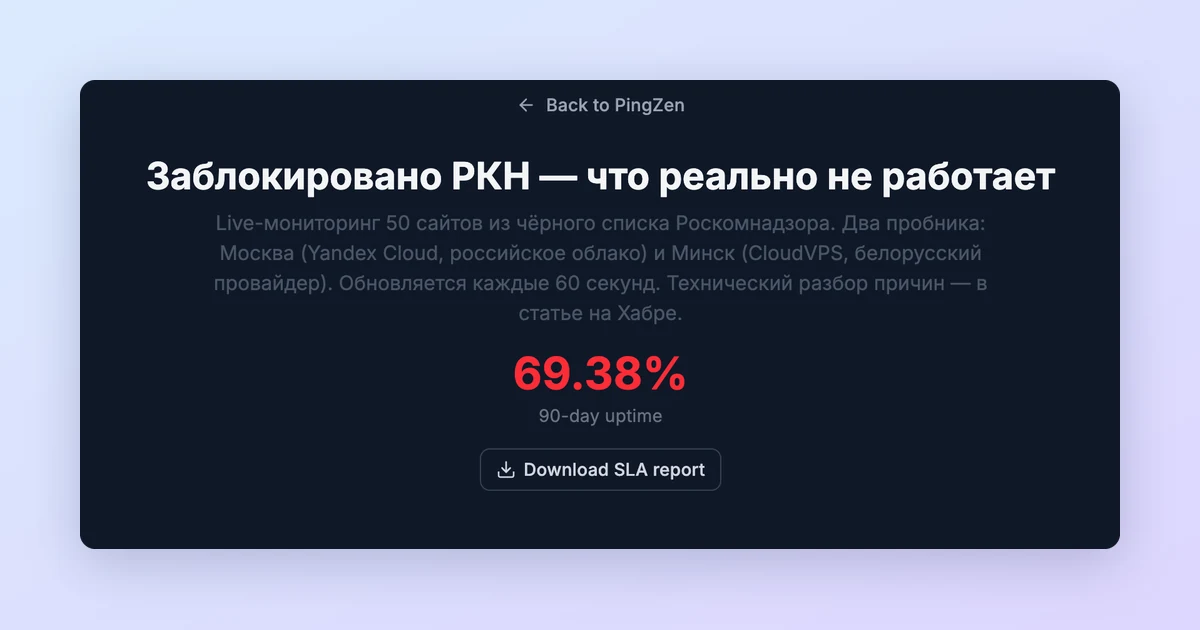
Read article →Every public status page now has a Download SLA report button. Visitors get a 90-day PDF — overall uptime, per-service windows, daily history, incidents — without an account, and you don't configure anything.
Read article →Invite colleagues to a workspace with viewer or editor roles. They see your monitors and configure their own alerts — all within the owner's plan limits, no shared logins, no duplicate checks.
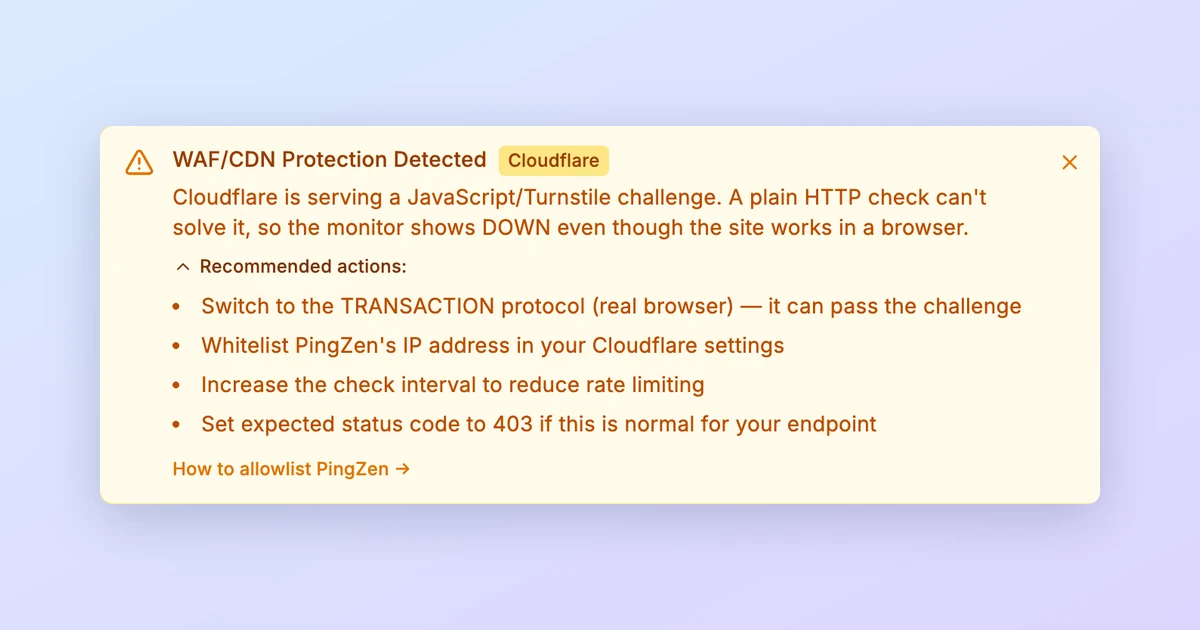
Read article →When a site sits behind a Cloudflare JavaScript/Turnstile challenge, PingZen now says so explicitly — and tells you exactly how to stop the false DOWN.
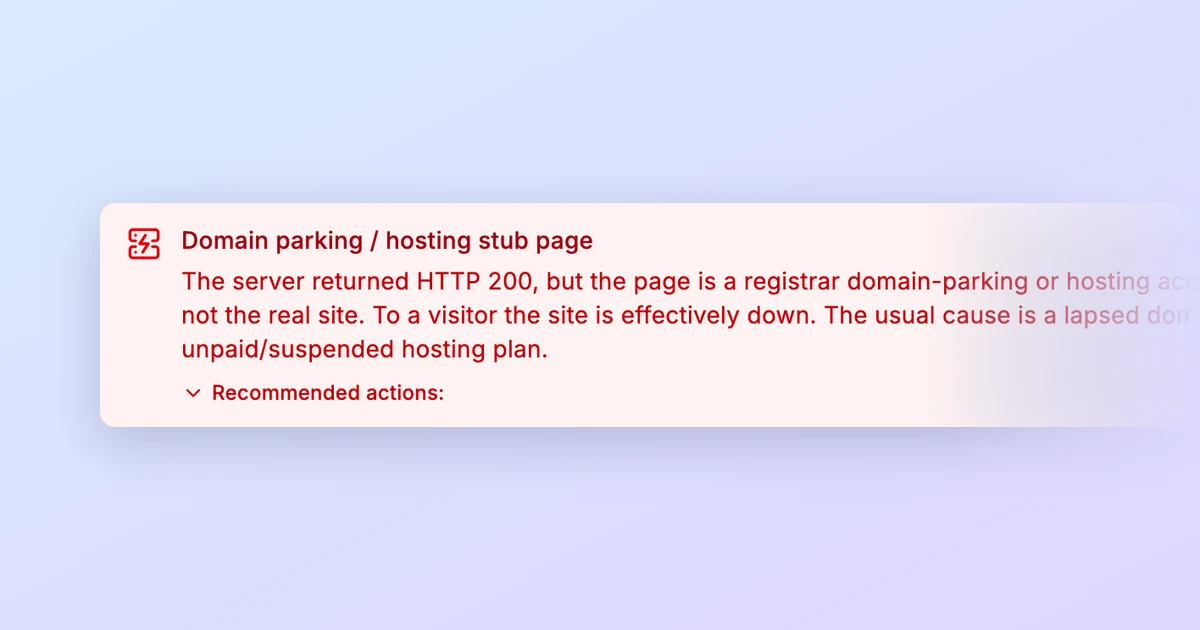
Read article →An expired domain or unpaid hosting bill replaces your site with a parking page that still returns HTTP 200 — so classic uptime monitoring stays green while visitors see a dead site. Here is how PingZen catches it.
Read article →An expired TLS certificate takes your whole site down and scares away every visitor. Here is how to monitor certificate expiry and get alerted days in advance.
Read article →Public monitoring services can't reach 10.x or 192.168.x addresses. Private probes let you watch internal databases, NAS boxes, and intranet apps from the same dashboard.
Read article →