Heartbeat Monitors, Upgraded: A Dead Cron Can't Hide Anymore
Heartbeat monitors are the quiet workhorses of PingZen: instead of us probing your service, your cron job or pipeline pings a URL to say “I’m alive,” and if a ping doesn’t arrive in time, you get alerted. They’re perfect for backups, ETL jobs, and queue workers — the things no one watches until they silently stop.
That “silently” was the problem. A dead heartbeat used to be too easy to miss, and once you suspected one, there was no way to look at it. We fixed both, and cleaned up the create flow while we were there.
A dead heartbeat can’t hide anymore
Here’s the bug that started this. If a regular monitor goes down, the whole app tells you: the sidebar flips to System: Critical, the Monitors nav badge turns red, the dashboard “Down” tile jumps. A heartbeat going down did none of that. The sidebar still said “System: Healthy” and the dashboard still read “Down: 0” — the exact opposite of what you need from a monitoring tool.
Now a DOWN heartbeat is treated as the critical event it is:
- The sidebar status dot goes Critical the moment a heartbeat misses — on every page, not just the Monitors view.
- The Monitors nav badge counts dead heartbeats alongside dead monitors.
- The dashboard shows a red “N heartbeat(s) down” line so a stopped cron is visible on the landing page.
- A workspace with only heartbeats now reports a real health status instead of a permanent “unknown.”
If your nightly backup stops pinging, you’ll see it the same way you’d see a website outage.
Click a heartbeat to see its pings
Heartbeats kept a full ping history all along — but there was nowhere to look at it. The rows just sat there. Now clicking any heartbeat opens a detail view.
Inside you get a compact timeline of ping arrivals — one bar per ping, coloured by signal (a green success, a blue ping, a start, a red fail) so you can see the rhythm of your job at a glance and spot the gap where it stopped. Below it, a table of the most recent pings with their exact timestamps and durations.
It’s read-only and deliberately built on the ping history you already have — no setup, nothing to enable. Click a heartbeat, see when it last checked in and how regularly. Editing, pausing, and deleting still live right there in the same view.
Smaller fixes that add up
While we were in the heartbeat code, a few papercuts got fixed:
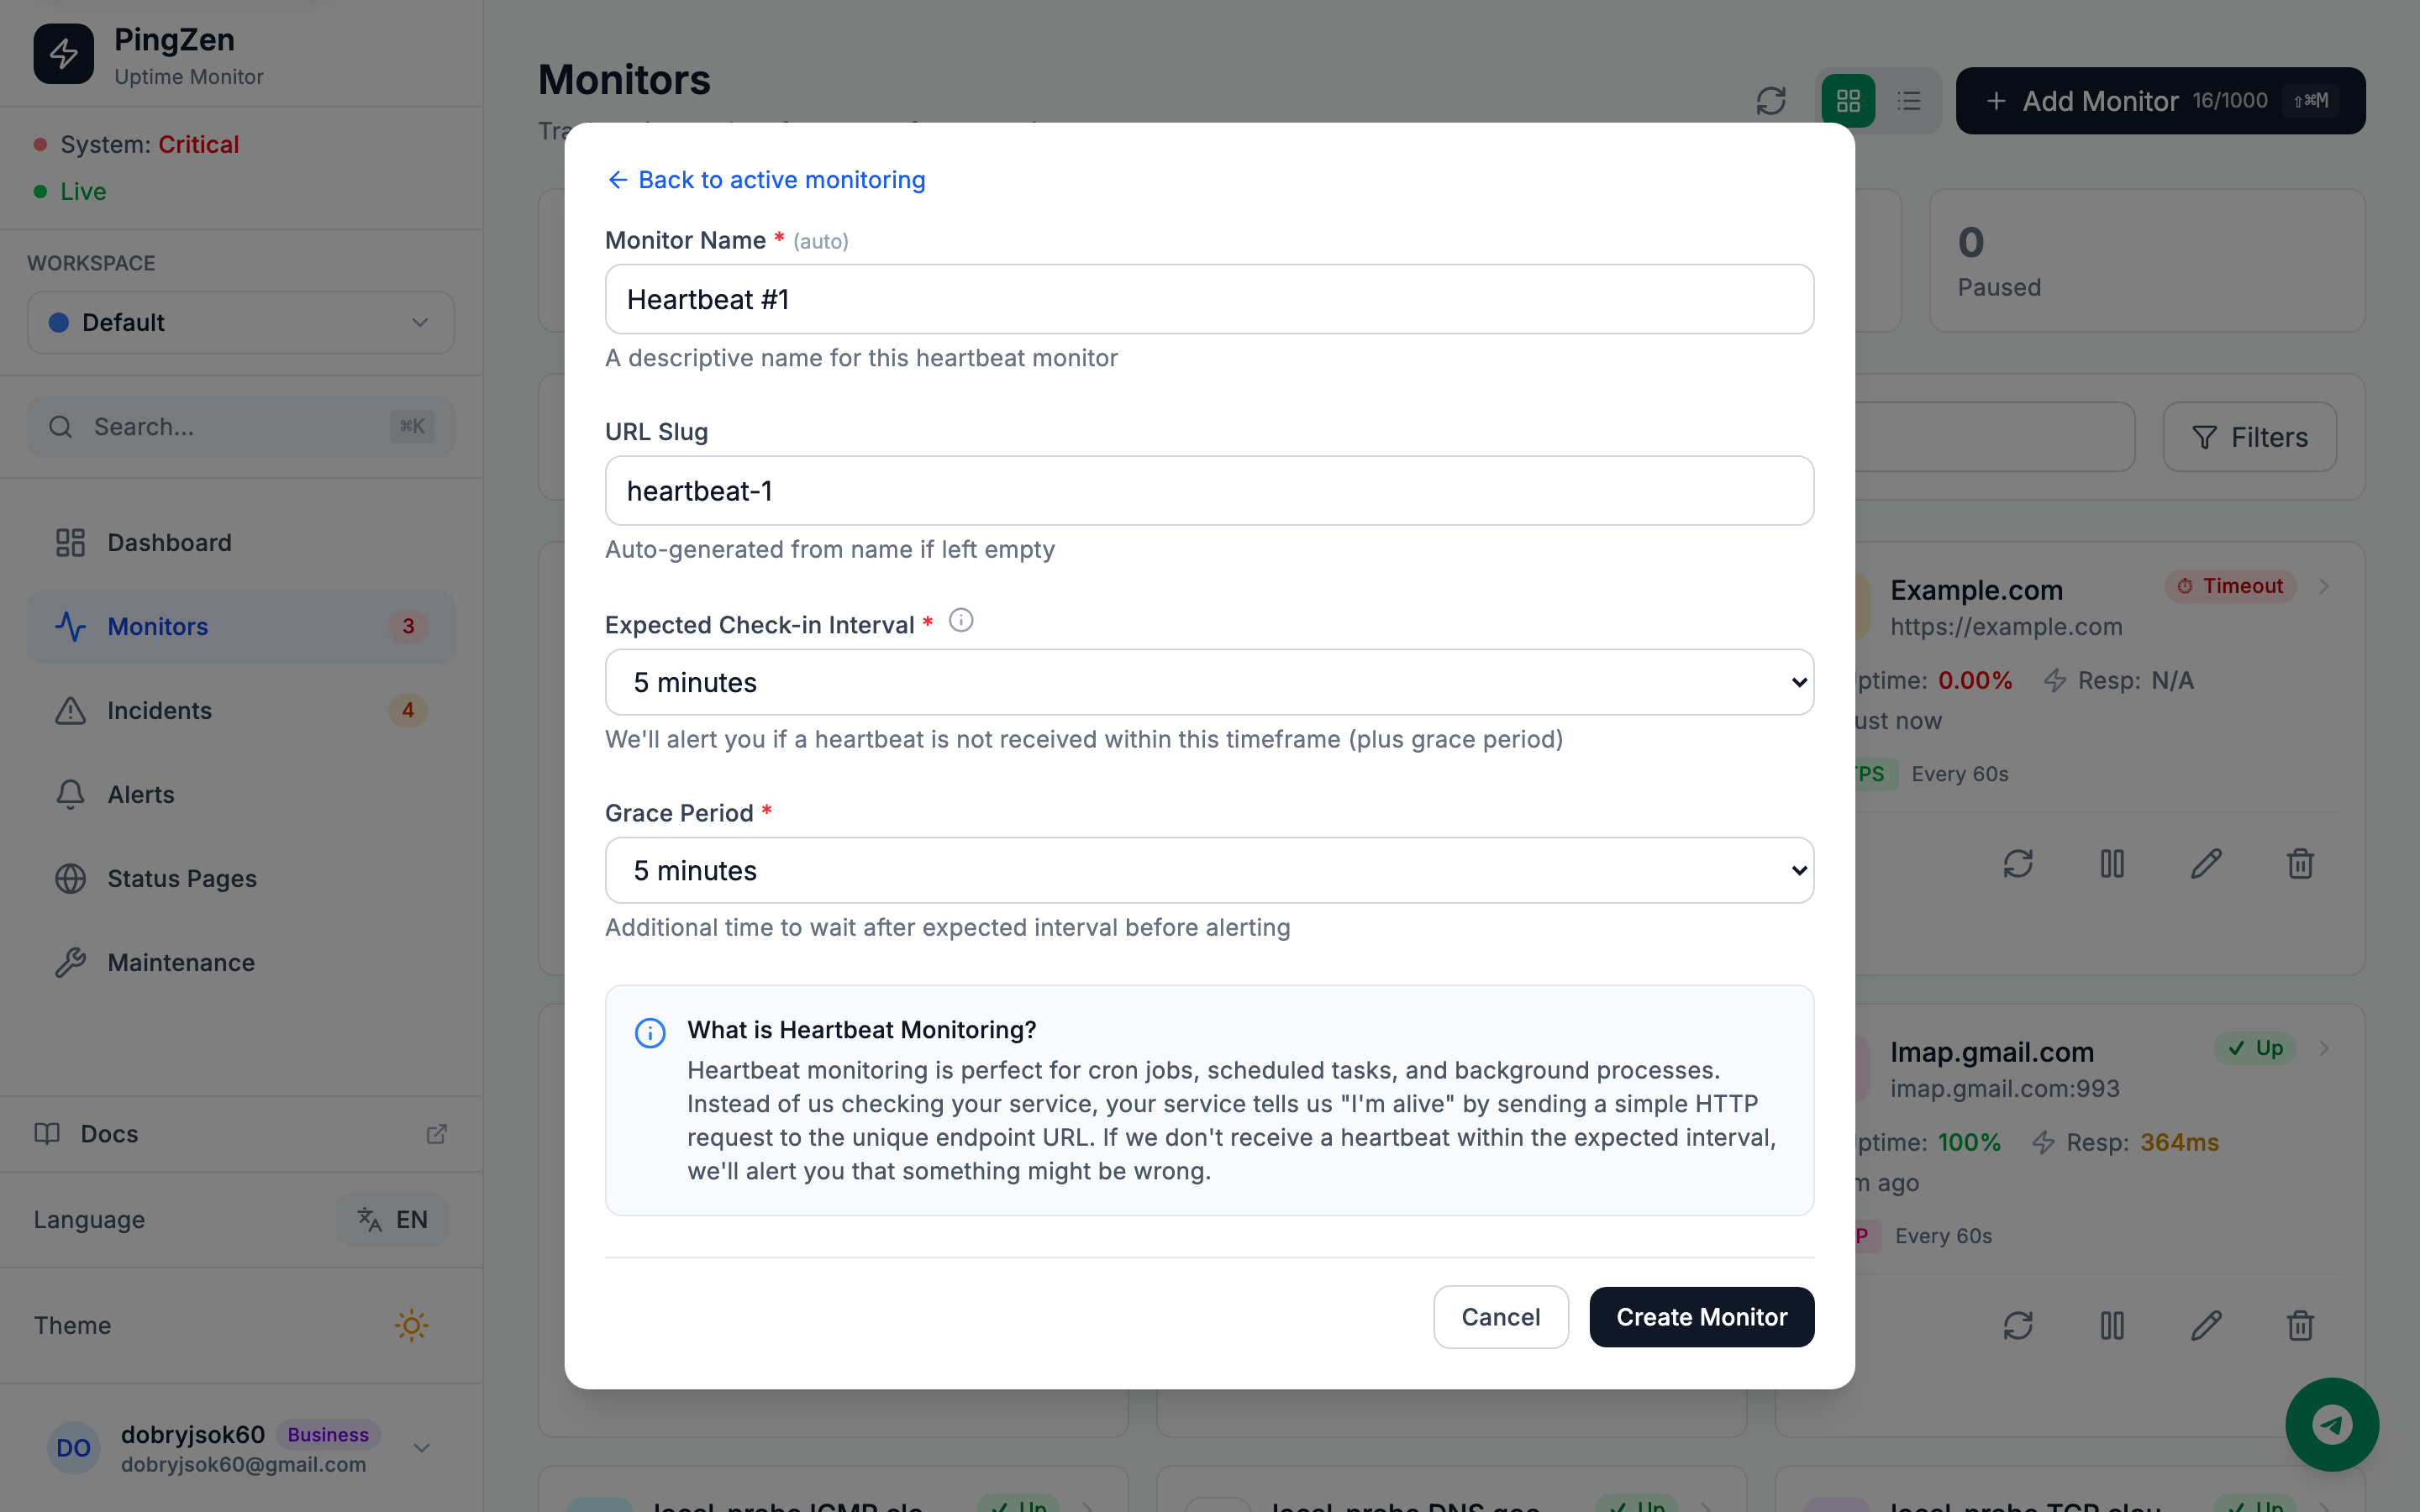
- Creating a heartbeat won’t fail with a cryptic error anymore. A short name like “Backup” used to auto-fill a slug the server then rejected, throwing an error about a field you never touched. The slug is now always valid.
- Deleting a heartbeat updates your plan counter instantly instead of leaving the “X / 55” number stale for half a minute — which mattered if you deleted one to get back under your limit.
- Accessibility and dark-mode polish — proper labels on the interval and grace-period fields, and a config line that’s actually readable on a dark background.
Nothing flashy, but the create-and-manage flow is noticeably smoother.
Heartbeat monitoring is one of those features you set up once and forget — which is exactly why it has to be loud when something breaks and easy to inspect when you go looking. That’s the bar we just cleared. If you run cron jobs, scheduled tasks, or background workers, point one at a heartbeat URL and let PingZen watch the silence for you.